BILJOU
Forest water balance model
![]() - Silva Joint Research Unit
- Silva Joint Research Unit


Maps of drought indices
Objectives and targeted users
The soil water deficit is the climatic phenomenon that has the greatest impact on the inter-annual variability of forest productivity in France. It also determines a large part of the inter-annual variations in crown conditions, as they are described in the Permanent Network for Forest Health Monitoring, for example. However, without clear records and mapping, it is very hard to conserve knowledge of the driest years, the spatial extent of droughts in France and their onset and duration.
In order to interpret their own observations and measurements, forest managers and those in charge of forest inventories or forest health monitoring need spatialized, retrospective information on the drought events that have affected forests in metropolitan France. Indeed, extreme drought events induce delayed declines in crown condition with a time lag of from one to several years. Questions may also arise several years after the drought event, as when narrow growth rings are observed at tree harvest or when dieback is reported.
To meet this need, this part of the Biljou web site presents past changes in soil water reserves in various types of forests, through annual or average indicators of soil water deficit. This makes spatial and temporal comparisons of drought duration, onset and intensity possible.
We provide the user with drought maps that we have pre-calculated through water-balance modelling with the Biljou© software. The interface offers user-friendly, ergonomic features of online mapping, making it quick and easy to visualise numerous maps of France representing different characteristics of a given drought event.
How were the Forest Drought Maps Computed and by Whom?
The Biljou© team of the UMR SILVA implemented several stages in order to provide these climate services, as illustrated below.
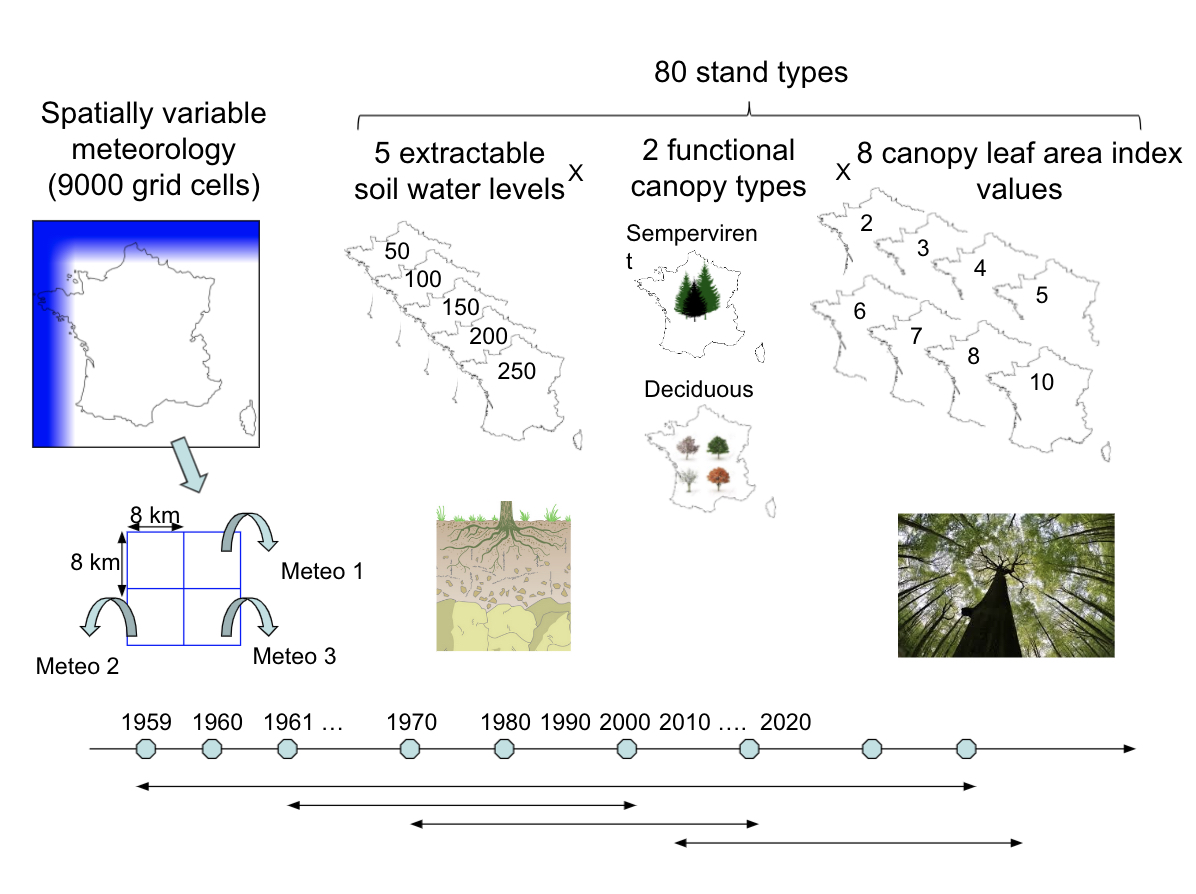
We imagined a wide range of stands characterized by a combination of three features: forest canopy functional type x leaf area index x soil properties. Daily water balance calculations were performed between 1959 and 2019 and organized in a spatial database for the entire metropolitan territory, covered by any one of the 80 stand types.
Disclaimer: The maps do not represent the actual spatial distribution of soils, deciduous or evergreen stands. The maps are merely an assistance to the geolocalization of the user's request. Remember that the choice is made here to cover the whole metropolitan territory by the stand x soil type selected by the user. They therefore only make it possible to compare a stand x soil type installed in different geographical locations characterized by contrasting annual and average meteorology.
Two functional canopy types
Evergreen canopy: mostly coniferous trees or evergreen hardwoods
Deciduous canopy: deciduous trees and larch; for this first version of the maps, the phenology was fixed spatially and temporally; the leafy season extends from April 20 to the end of October. Later versions will include variable phenology.
Eight leaf area index values
For each forest functional type, the user can select a leaf area index value of 2, 3, 4, 5, 6, 7, 8 or 10, depending on his or her knowledge of the target stand. To help choose the most relevant value, the user can refer to the web page dedicated to leaf area index.
Five soil types
Five soil types were selected from the INRAE-Infosol soil database in Orléans. They cover a broad range of soil extractable water levels (from 50 to 250 mm). For each soil, the main physical properties (horizon depth, bulk density, distribution of fine roots and water content at field capacity and at the point of permanent wilting) are real and measured data.
A spatialized meteorology
The simulated climate forcing of historic variability in soil water balance in Metropolitan France varies at intervals of 8 km. A separate daily meteorology file was created for each of the 9000 regular cells in the 8 km x 8 km grid based on the Safran analysis extended to France (Météo France). To date, all the weather records from 1959 to 2020 have been integrated. Periodic updates will be made as the Safran mesoscale atmospheric reanalysis is extended.
How to consult the maps?
Two viewing modes are available:
* Guest mode. In this mode, the user can visualize the maps of the different soil water deficit indices and zoom in on his/her area of interest, but he/she does not have access to the exact numerical value of the index consulted.
* Connected mode. In addition to the features of the guest mode, the user has access to the value of the indices for each grid cell. For the connected mode, the user must register online by completing a simple form and accepting the data use license.
Consultation and functionalities
The cartographic functionalities offered to the user differ according to the consultation mode.
The user must select the characteristics of his stand of interest: deciduous or evergreen, leaf area index, soil extractable water, as well as the he wants to know the characteristics of the soil water deficit.. The operator can display maps of drought indicators, anomalies or statistics. He can also choose to display different additional layers to refine his localization: the remote sensing image allowing to locate the forests, the hydrographic network, the large ecological regions (GRECO, IFN), the new French administrative regions. He can also indicate the latitude and longitude of a particular point.
- In guest mode, the operator can view the map image, zoom in on the map or easily switch from one indicator family to another.
- In connected mode: in addition to the features of the guest mode, the user has access, by a simple mouse click on a grid cell, to the value of the indicator whose map he has chosen to display. Moreover, a map comparator allows to display side by side two maps whose comparison is relevant.
This comparator was designed to meet the recurring needs that users have expressed to us. For example:
- Was the soil water deficit in my area of interest more severe in 1976 or 2003 for evergreen species?
- Was the duration of the drought in 2011 in my region longer than the average duration in broadleaved forests?
- Did the soil water deficit in 1996 occur much earlier in evergreen stands than in deciduous stands?