BILJOU
Forest water balance model
![]() - Silva Joint Research Unit
- Silva Joint Research Unit


Types of drought maps
Three families of maps are available that can be displayed alternately or side by side with the “compare” function.
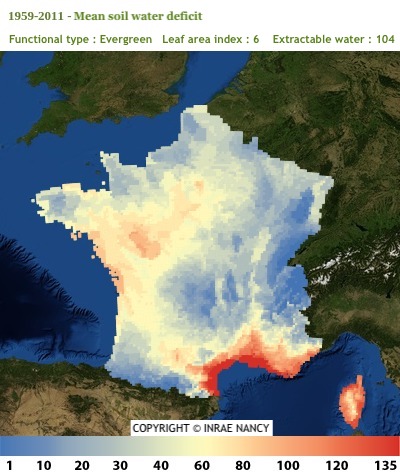
Statistical maps of drought indicators
The statistical maps of drought indicators are calculated from a series of successive maps over a given time period. Currently, the statistical maps are calculated grid cell by grid cell over 30-year periods based on all the available year. The user may adjust the desired parameters.
Proposed indicators: average soil water deficit, median date of water deficit onset, and average duration of water deficit.
Go to maps
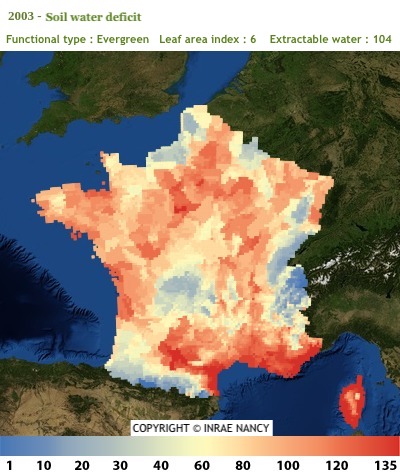
Maps of drought indicators
For a given year and a selected stand type, three maps are proposed. Each 8 x 8 km grid cell contains one indicator value, coloured according to a scale between extreme values.
Proposed indicators: soil water deficit, duration of soil water deficit, onset of soil water deficit.
Go to maps
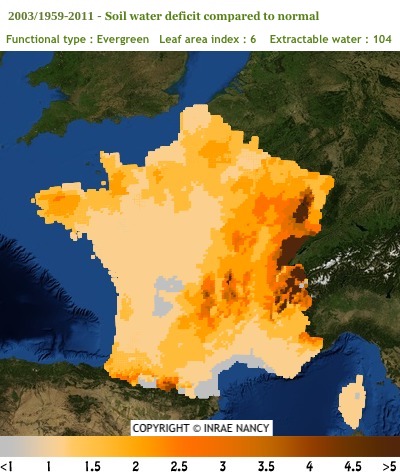
Relative drought indicator (or anomaly) maps
Each of the three previous indicators is associated with a relative indicator, also called an anomaly. For each grid cell, one of the raw drought indicators is expressed as relative to the statistics for this same indicator over a period of time chosen by the user.
Proposed indicators (or anomalies) : water deficit for a year n relative to the average water deficit over the chosen period; soil water deficit onset for year n relative to the median starting date of water deficit over the chosen period; relative duration of the water deficit for year n relative to the average water deficit duration calculated over the chosen period. Example: water deficit map for 2003 relative to the average water deficit over the period 1959 to 2011.
Go to maps