BILJOU
Forest water balance model
 - Silva Joint Research Unit
Transpiration and water flux regulation
How is this defined?
The actual evapotranspiration (AET, mm) of plant cover is the sum of all the water vapour fluxes to the
atmosphere :
AET
=
tree transpiration
+
soil evaporation and understory herbaceous transpiration
+
evaporation of water intercepted through the canopy
Climate variables which determine AET of plant surfaces are : :
- variables known for forcing that impose climatic demands (see the page Meteorology),
- precipitation affecting soil water availability and consequently the tree's system for regulation (stomatal regulation) in conditions of water scarcity or water deficit.
Tree transpiration is the predominant term in actual evapotranspiration. When the stand is closed and the leaf area index is high, soil and understory evapotranspiration is often low, even negligible, as evaporative demand is reduced below the canopy.
How is AET measured? What unit is used for this measurement?
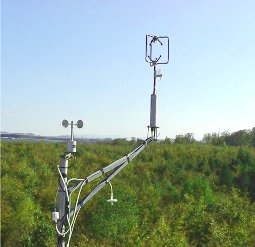
There currently exists a proven method for measuring the water vapour flux above a canopy: the eddy covariance method. This method combines a three-dimensional sonic anemometer and a fast infra-red gas analyzer.


Above : three-dimensional sonic anemometer installed on the top of a eddy-flux tower (eddy covariance measurement system).
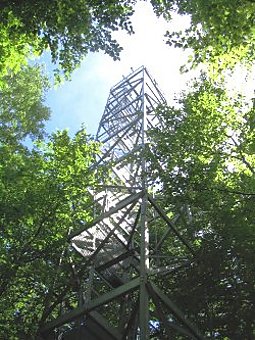
Left : eddy-flux tower of the forest of Hesse (57), a site managed by INRA-Nancy.
Another method, known as water balance, is used to estimate the AET considering changes in soil water content and
rainfall from below the canopy. This method does not provide accurate temporal resolution as the time required is
generally a week or longer. In addition, the high spatial variability of the soil water content due to the tree's
uptake requires a high number of replicates.
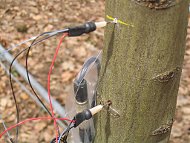
 Sap flow measurement in trees trunks.
Transpiration is expressed in litres (or kg) of water per time period. Similar to precipitation, stand transpiration is usually expressed in mm (= 1 L/m2).
How is the water flow controlled?
Transpiration is directly dependent on the energy intercepted by tree crowns. Potential evapotranspiration (PET),
which drives transpiration, quantifies the atmospheric demand (see the
page meteorology).
PET is a function of global radiation, temperature, air humidity and wind speed. We have shown that a tree's
transpiration in a closed stand with high leaf area index and no water stress can reach a maximum of 75% of
PET. When the leaf area index is lower (below 6), transpiration decreases. For broad-leaf stands during leaf
expansion, leaf yellowing and the leaf fall phase, transpiration is less than maximal.
In the case of drought, relative extractable soil water (REW) decreases. When REW drops below 0.4, trees consequently
experience water stress which induces stomatal closure and reduces transpiration. It is interesting to know that this
threshold of soil water deficit can be applied to a large number of species and soil types.
Another component of AET is the soil layer evapotranspiration, which is equal to the sum of soil evaporation and
understory transpiration. Here, we call understory the herbaceous layer. The woody understory layer, i.e.
the understory as forest managers often refer to as coppice (e.g. composed of hornbeams in an oak or beech stand)
is integrated in the leaf area index of the stand. Herbaceous sub layer evapotranspiration depends principally on
the energy available below the tree's canopy. As such, the BILJOU© model is designed to calculate global radiation
which reaches the sub layer. This calculation involves both the stand's global incident radiation (see the page
meteorology and the stand's leaf area index.
How does transpiration vary with time?
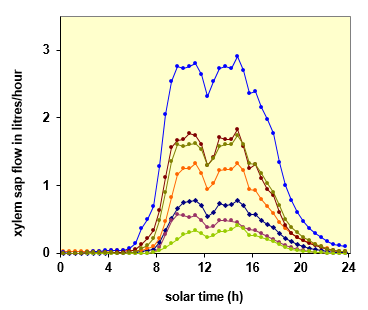
 Variation in transpiration taken in one day during the summer, from 7 beech trees growing in a closed stand (Hesse forest, Moselle). There is a 1 to 10 ratio between minimum and maximum rates.
How does transpiration vary spatially?
In a forest stand, transpiration varies considerably between trees, as we have shown in sap flow measurements
on the opposite figure.
Variation in transpiration from one tree to another relates mainly to the trees' social status, the dominant trees
showing higher transpiration rates due to their higher leaf area and the fact that their crowns are located in more
favourable microclimatic conditions than smaller trees.
In a forest stand, there may also exist spatial
variations relative to soil heterogeneities and gaps in the canopy.
However, modelling for water balance
at stand scale requires constant conditions. Therefore, a heterogeneous plot should be divided in more
homogeneous sub-elements. Forest managers generally achieve this by setting basic management units.
Some key figures
During the course of a sunny day with high soil water conditions, stand transpiration typically reaches 2 to 4 mm / day (= 20 - 40 m3/ha/day). When a stand is closed, tree age becomes less a factor in transpiration. In other words, if there are 2,000 trees (i.e. a young stand) per hectare, each tree will transpire on average between 10 and 20 litres of water per day. If there are 200 trees (i.e. an older stand), transpiration of one tree will be around 100 to 200 litres per day.
Useful references
![]() Aussenac G., Granier A. (1979) Etude bioclimatique d'une futaie feuillue (Fagus silvática L. et Quercus
sessiliflora Salisb.) de l'Est de la France II. Etude de l'humidité du sol de l'évapotranspiration
réelle. Annales des Sciences Forestières, 36, 265-280.
Aussenac G., Granier A. (1979) Etude bioclimatique d'une futaie feuillue (Fagus silvática L. et Quercus
sessiliflora Salisb.) de l'Est de la France II. Etude de l'humidité du sol de l'évapotranspiration
réelle. Annales des Sciences Forestières, 36, 265-280.
![]() Bréda N., Cochard H., Dreyer E., Granier A. (1993) Water transfer in a mature oak stand (Quercus petraea): seasonal evolution and
effects of a severe drought. Canadian Journal of Forest Research, 23, 1136-1143
Bréda N., Cochard H., Dreyer E., Granier A. (1993) Water transfer in a mature oak stand (Quercus petraea): seasonal evolution and
effects of a severe drought. Canadian Journal of Forest Research, 23, 1136-1143
![]() Granier A, Biron P, Bréda N, Pontailler J Y, Saugier B (1996) Transpiration of trees and forest stands: Short and longterm monitoring using
sapflow methods. Global Change Biology 2(3): 265-274
Granier A, Biron P, Bréda N, Pontailler J Y, Saugier B (1996) Transpiration of trees and forest stands: Short and longterm monitoring using
sapflow methods. Global Change Biology 2(3): 265-274
![]() Granier A, Loustau D, Bréda N (2000) A generic model of forest canopy conductance dependent on climate, soil water availability and leaf
area index. Annals of Forest Science 57: 8,755-765
Granier A, Loustau D, Bréda N (2000) A generic model of forest canopy conductance dependent on climate, soil water availability and leaf
area index. Annals of Forest Science 57: 8,755-765
![]() Lagergren F, Lindroth A (2002) Transpiration response to soil moisture in pine and spruce trees in Sweden. Agricultural and
Forest Meteorology 112(2): 67-85
Lagergren F, Lindroth A (2002) Transpiration response to soil moisture in pine and spruce trees in Sweden. Agricultural and
Forest Meteorology 112(2): 67-85
![]() Vincke C, Bréda N, Granier A, Devillez F (2005a) Evapotranspiration of a declining Quercus robur (L.) stand from 1999 to 2001. I.
Trees and forest floor daily transpiration. Annals of Forest Science 62(6): 503-512
Vincke C, Bréda N, Granier A, Devillez F (2005a) Evapotranspiration of a declining Quercus robur (L.) stand from 1999 to 2001. I.
Trees and forest floor daily transpiration. Annals of Forest Science 62(6): 503-512

