
BILJOU
Forest water balance model
 - Silva Joint Research Unit
⚠ WARNING: SERVICE INTERRUPTION FROM MARCH 20 TO 24 ⚠
Water balance modelling
How is this defined?
Modeling the water balance is the translation of the biophysical processes (e.g. tree transpiration, interception of precipitation) in a set of equations. These equations are based on measurements taken from a large number of forest stands of a wide variety of species under different climatic and soil conditions, ages and management techniques. The Biljou© model operates on a daily time interval. This calculated interval represents a compromise between:
- A brief interval (by the hour), which presents the problem of meteorological data availability and makes difficult to represent accurately some transient phenomena, and
- A longer interval (by month or by decade) not allows to break down of a number of processes, notably inability to represent properly the phenomena occurring at short term such as the regulation of tree transpiration.
What are the different functions?
The water balance page describes the general organization of water fluxes exchanged in a forests ecosystem. In the Biljou© model each water flux is represented by one or more equations, with the exception of drainage, which are calculated by their differences.
Variation in leaf area index
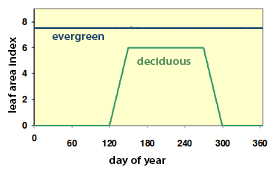
Variation in leaf area index.
Tree transpiration and its regulation (T)
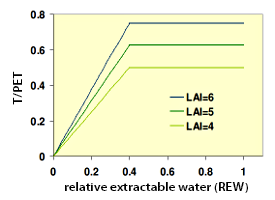
Variation in transpiration to PET ratio as a function of relative extractable soil water taken for different leaf area index levels (LAI).
Precipitation interception (In)
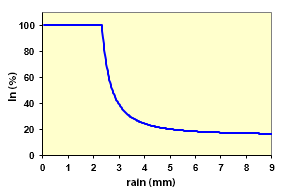
Function giving the ratio of interception to incident rainfall.
Rain that reaches the ground level (i.e. throughfall) is calculated as being the difference between incident rainfall and interception (see the provided graph and the page precipitation interception).
Soil and understory evapotranspiration (ETu)
This water flux is directly dependent on the radiative energy that reaches the soil surface of this ecosystem: depending on, incidental radiation and the LAI (in the absence of leaves, the WAI or wood area index; see the page transpiration and regulation).
Drainage (Dr)
It is calculated as the difference between the water input and losses through the equation : Dr = Pi – In – T - ETu (see the web page Drainage).
Soil moisture measurements show that after rain has reached dry soil, rehydration dynamics is slower than expected.
In effect, the macroporosity will allow for rapid water flow, even if the soil moisture has not reached field
capacity. This phenomenon of preferential water flow is even more pronounced in soils with visible cracks as a
result of their drying. The Biljou© model takes into account this phenomenon; for each soil layer, drainage is
calculated as follows:
- if the soil layer is at field capacity, additional water input is removed by drainage,
- if soil is drier, a part of water input is drained following macroporosity, while the remaining part moistens the soil layer.
The figure below shows the difference between two simulations of relative extractable soil water (REW) for two cases and considers the presence or absence of rapid fluxes through the macroporosity.
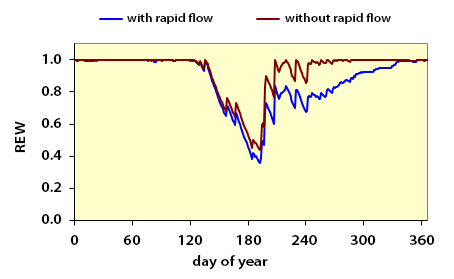
Differences between two simulations of the relative extractable soil water (REW) for two hypotheses - with and without rapid fluxes through the macroporosity.
General Organization Model
The model uses daily weather data (see the page Meteorology) :
- precipitation
- air temperature
- relative humidity, water vapour pressure or air vapour pressure deficit
- wind speed
- global radiation
Certain parameters characterizing the soil and the stand are necessary to run the model:
- stand type : deciduous or evergreen
- dates of bud burst and full leaf fall for deciduous stands
- the maximum leaf area index of the canopy
- the hydrodynamical and soil physical characteristics and the proportion of fine roots in each soil layer ( 2 or 3 layers)
The model will run the following calculation loop each day:
- Calculation of PET, using the meteorological variables
- Calculation of the rainfall interception and of throughfall
- Calculation of the sub-layer evapotranspiration
- Calculation of transpiration, possibly limited when REW is less than 0.4
- Addition of thoughfall to the soil reserves. For each soil layer at the site, a part of the throughfall rehydrates this layer, the remainder will migrate via drainage into the next layer. The final drainage is what comes from the deeper soil layer.
- Subtraction of sub layer evapotranspiration from the surface layer
- Subtraction of transpiration from the different soil layers
- Calculation of the new soil water content and the REW
- End of daily loop
At the end of each year, the balance of the various fluxes and drought indices
(duration, intensity, area) are calculated over one full year for evergreen stands or over the
period between bud burst and leaf fall for deciduous stands.
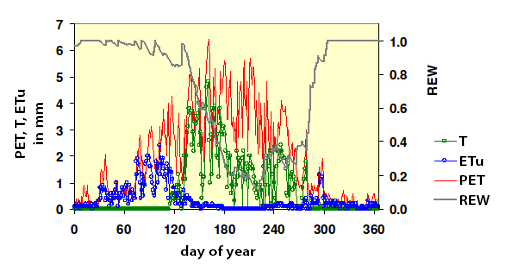
Variations in potential evapotranspiration (PET), transpiration (TR) and of sub layer evapotranspiration (ETu) in a beech stand over the period of one year and of the soil water reserve (REW).
Useful reference
![]() Granier A, Badeau V, Bréda N (1995) Modélisation du bilan hydrique des peuplements forestiers. Revue
Forestière Française, XLVII, 59-68.
Granier A, Badeau V, Bréda N (1995) Modélisation du bilan hydrique des peuplements forestiers. Revue
Forestière Française, XLVII, 59-68.
![]() Badeau V, Bréda N (2008) Modélisation du bilan hydrique : étape clé de la détermination des paramètres et
des variables d’entrée. RDV techniques hors-série n°4 – ONF.
Badeau V, Bréda N (2008) Modélisation du bilan hydrique : étape clé de la détermination des paramètres et
des variables d’entrée. RDV techniques hors-série n°4 – ONF.
![]() Granier A, Breda N, Biron P, Villette S (1999) A lumped water balance model to evaluate duration and intensity of
drought constraints in forest stands. Ecological Modelling 116: 269-283.
Granier A, Breda N, Biron P, Villette S (1999) A lumped water balance model to evaluate duration and intensity of
drought constraints in forest stands. Ecological Modelling 116: 269-283.
 Courbet F, Doussan C, Limousin J-M, Martin-St Paul N, Simioni G (2022) Forêt et changement climatique - Comprendre et modéliser le fonctionnement hydrique des arbres. Editions Quae, collection Synthèses, 144 p.

